Last Updated on: 31st March 2026, 06:27 pm
Power BI DAX (Data Analysis Expressions) solutions involve mastering a blend of fundamental functions, context manipulation, and time intelligence to transform raw data into actionable insights.
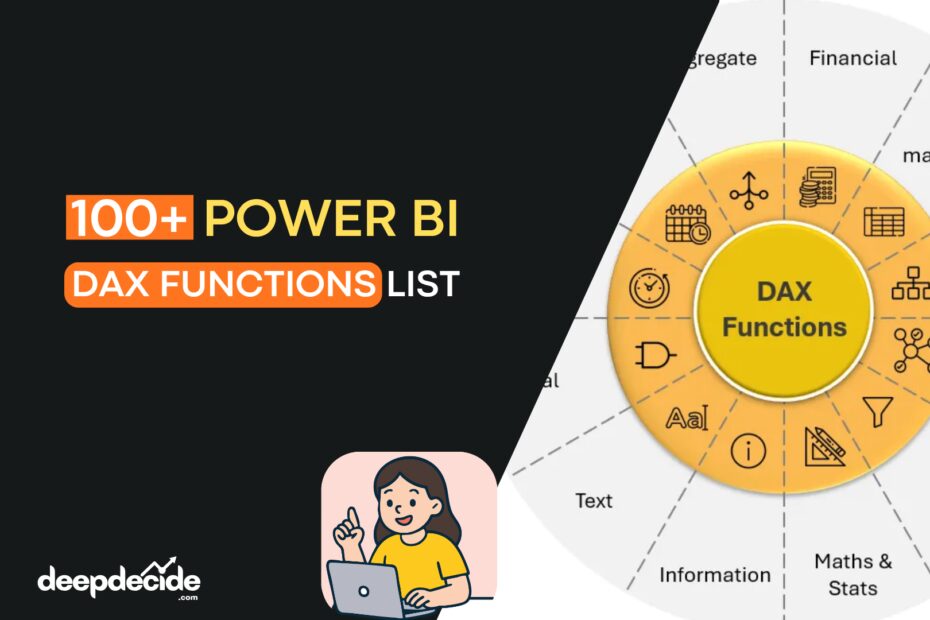
Introduction to DAX Function Categories
DAX (Data Analysis Expressions) functions are organized into categories based on their purpose and behavior. Understanding these categories is essential because each type operates under different evaluation rules—some iterate row by row, others modify filter context, and some return tables instead of scalar values. The categories help you quickly identify which function to use based on what you are trying to achieve.
1. Aggregation Functions
Basic Math, Iterators, and Counting
Aggregation functions perform mathematical operations on columns, returning a single scalar value. They form the foundation of most measures.
SUMSUM(column)
Total Revenue = SUM(Sales[Revenue])
SUM adds all numeric values in a column. It ignores blanks. This is the most frequently used aggregation. SUM works only on a single column; if you need to sum an expression across rows, use SUMX.
Context Behavior: SUM respects the current filter context. If a user selects a specific year or region, SUM only calculates visible rows.
Context Behavior: SUM respects the current filter context. If a user selects a specific year or region, SUM only calculates visible rows.
SUMXSUMX(table, expression)
Line Total = SUMX(Sales, Sales[Quantity] * Sales[UnitPrice])
SUMX is an iterator. It evaluates the expression for each row of the specified table, then sums the results. Use SUMX when your calculation involves multiple columns or custom logic per row.
Row Context: SUMX creates a row context, meaning it processes each row individually. This is powerful but can be slower on large tables if not optimized.
Row Context: SUMX creates a row context, meaning it processes each row individually. This is powerful but can be slower on large tables if not optimized.
AVERAGEAVERAGE(column)
Avg Order Value = AVERAGE(Sales[Amount])
AVERAGE returns the arithmetic mean of a column. It sums all numbers and divides by the count of non-blank values. Blanks are ignored, but zeros are included in the division.
AVERAGEXAVERAGEX(table, expression)
Avg Daily Sales = AVERAGEX(VALUES('Date'[Date]), [Total Sales])AVERAGEX iterates over a table and averages the results of an expression per row. Useful when you need to average calculated values rather than raw column values.
MIN / MAXMIN(column) / MAX(column)
Earliest Order = MIN(Sales[OrderDate])
Latest Order = MAX(Sales[OrderDate])
MIN / MAX returns the smallest or largest numeric value in a column. For text columns, MIN returns the lowest alphabetical value; MAX returns the highest.
MINX / MAXXMINX(table, expression) / MAXX(table, expression)
Highest Single Line Value = MAXX(Sales, Sales[Quantity] * Sales[UnitPrice])
MINX / MAXX iterates over a table and returns the minimum or maximum value of the expression evaluated per row.
COUNT / COUNTACOUNT(column) / COUNTA(column)
Orders with Amount = COUNT(Sales[Amount])
Orders with Any Value = COUNTA(Sales[Notes])
COUNT only counts rows where the column contains a number. COUNTA counts rows where the column is not blank, regardless of data type.
COUNTROWSCOUNTROWS(table)
Order Count = COUNTROWS(Sales)
COUNTROWS counts the number of rows in a table. This is often faster than COUNT on a specific column because it does not evaluate column data.
DISTINCTCOUNTDISTINCTCOUNT(column)
Unique Customers = DISTINCTCOUNT(Sales[CustomerID])
DISTINCTCOUNT counts the number of unique values in a column, excluding blanks. This is equivalent to
COUNTROWS(DISTINCT(Table[Column])).COUNTX / COUNTAXCOUNTX(table, expression) / COUNTAX(table, expression)
Count High Value Orders = COUNTX(Sales, IF(Sales[Amount] > 1000, 1, BLANK()))
COUNTX / COUNTAX iterates over a table and counts rows where the expression evaluates to a number (COUNTX) or non-blank (COUNTAX).
2. Filter Functions
CALCULATE, ALL, FILTER, and Context Manipulation
Filter functions are the most powerful category in DAX. They allow you to manipulate filter context, which is what makes DAX dynamic.
CALCULATECALCULATE(expression, filter1, filter2, …)
Sales 2023 = CALCULATE(SUM(Sales[Amount]), 'Date'[Year] = 2023)
CALCULATE is the most important DAX function. It evaluates an expression in a modified filter context. Each filter argument can be a Boolean expression, a table expression, or a filter modification function like ALL or KEEPFILTERS. CALCULATE overwrites existing filters unless KEEPFILTERS is used.
Context Modification: When you add a filter, CALCULATE replaces the existing filter context on those columns with the new filter. It does not add to it unless you use KEEPFILTERS.
Context Modification: When you add a filter, CALCULATE replaces the existing filter context on those columns with the new filter. It does not add to it unless you use KEEPFILTERS.
CALCULATETABLECALCULATETABLE(table, filter1, …)
HighValueOrders = CALCULATETABLE(Sales, Sales[Amount] > 5000)
CALCULATETABLE is same as CALCULATE but returns a table instead of a scalar value. Used when you need to create filtered table expressions.
FILTERFILTER(table, condition)
TopCustomerSales = CALCULATE(SUM(Sales[Amount]), FILTER(Customers, [Total Sales] > 100000))
FILTER returns a table that represents a subset of another table based on a Boolean condition. FILTER is an iterator that evaluates the condition for every row. It is often used inside CALCULATE when complex conditions involve multiple columns or aggregations.
ALLALL(table_or_column)
% of Total = DIVIDE([Total Sales], CALCULATE([Total Sales], ALL(Sales)))
ALL removes all filters from a table or column. When used as a filter in CALCULATE, it ignores any filters applied to that table or column. ALL is essential for calculating percentages of total and running totals.
Variations:
Variations:
ALL(Table) removes all filters from the entire table; ALL(Table[Column]) removes filters only from that column; ALL() as a function returns all rows of the table, ignoring context.ALLEXCEPTALLEXCEPT(table, column1, column2, …)
Sales Keep Region = CALCULATE(SUM(Sales[Amount]), ALLEXCEPT(Sales, Sales[Region]))
ALLEXCEPT removes all filters from a table except those on the specified columns. This is useful when you want to keep filters on certain dimensions while clearing others.
ALLSELECTEDALLSELECTED(table_or_column)
% of Selected Total = DIVIDE([Total Sales], CALCULATE([Total Sales], ALLSELECTED(Sales)))
ALLSELECTED removes filters but respects the filters applied by slicers and the current visual. It preserves the “selected” context from the report page. This is different from ALL, which removes everything including slicer selections.
VALUESVALUES(column)
Selected Region = SELECTEDVALUE(Regions[Region])
VALUES returns a one-column table containing the distinct values from a column, respecting the current filter context. If the column has blanks, VALUES includes a blank row. This is commonly used to retrieve the single selected value from a slicer or to iterate over visible items. (SELECTEDVALUE is a convenience wrapper around VALUES that returns blank if multiple values are selected.)
DISTINCTDISTINCT(column)
UniqueProductCount = COUNTROWS(DISTINCT(Sales[ProductID]))
DISTINCT is similar to VALUES but does not include blanks. DISTINCT returns only unique non-blank values. When used with a table argument, it returns a table with unique rows.
RELATEDRELATED(column)
Product Category = RELATED(Products[Category])
RELATED retrieves a value from a related table on the “many” side of a relationship. Used in calculated columns when you need to pull a value from a lookup table. RELATED follows the existing relationship direction.
RELATEDTABLERELATEDTABLE(table)
Total Product Sales = SUMX(RELATEDTABLE(Sales), Sales[Amount])
RELATEDTABLE returns a table of related rows from the “many” side. Used when you need to aggregate values from a detail table in a lookup table calculated column.
KEEPFILTERSKEEPFILTERS(expression)
Sales North = CALCULATE([Total Sales], KEEPFILTERS(Region[Name] = "North"))
KEEPFILTERS modifies how CALCULATE applies filters. Instead of replacing existing filters, KEEPFILTERS adds to them. The final filter is the intersection of existing filters and the new filters.
REMOVEFILTERSREMOVEFILTERS(table_or_column)
All Sales = CALCULATE([Total Sales], REMOVEFILTERS(Sales))
REMOVEFILTERS is a newer, more readable alternative to ALL when used as a filter remover. Explicitly removes filters from specified columns or tables.
3. Time Intelligence Functions
YTD, QTD, MTD, Date Shifting, and Period Calculations
Time intelligence functions simplify date-based calculations. They require a contiguous date table marked as a date table.
TOTALYTDTOTALYTD(expression, dates, filter, year_end_date)
YTD Sales = TOTALYTD(SUM(Sales[Amount]), 'Date'[Date])
TOTALYTD calculates the year-to-date total. It evaluates the expression for dates from the start of the year up to the current date in the context. The optional year_end_date defines the fiscal year end (e.g., “6/30” for June 30).
TOTALQTD / TOTALMTDTOTALQTD(expression, dates) / TOTALMTD(expression, dates)
QTD Sales = TOTALQTD(SUM(Sales[Amount]), 'Date'[Date])
MTD Sales = TOTALMTD(SUM(Sales[Amount]), 'Date'[Date])
TOTALQTD / TOTALMTD are quarter-to-date and month-to-date variants. They aggregate from the start of the quarter or month to the current date.
SAMEPERIODLASTYEARSAMEPERIODLASTYEAR(dates)
Sales PY = CALCULATE([Total Sales], SAMEPERIODLASTYEAR('Date'[Date]))SAMEPERIODLASTYEAR returns a table of dates shifted exactly one year back. It is used as a filter inside CALCULATE to get previous year values for the exact same date range.
DATEADDDATEADD(dates, number_of_intervals, interval)
Sales 3 Months Ago = CALCULATE([Total Sales], DATEADD('Date'[Date], -3, MONTH))DATEADD shifts dates forward or backward by a specified number of intervals (DAY, MONTH, QUARTER, YEAR). More flexible than SAMEPERIODLASTYEAR because you can shift by any amount.
DATESYTD / DATESQTD / DATESMTDDATESYTD(dates, year_end_date)
YTD Sales Alt = CALCULATE([Total Sales], DATESYTD('Date'[Date]))DATESYTD / DATESQTD / DATESMTD returns a table of dates from the start of the year (or quarter/month) up to the current date. Used inside CALCULATE instead of TOTALYTD when you need to combine with other filters.
FIRSTDATE / LASTDATEFIRSTDATE(dates) / LASTDATE(dates)
Period Start = FIRSTDATE('Date'[Date])
Period End = LASTDATE('Date'[Date])
FIRSTDATE / LASTDATE returns the first or last date in the current context for the specified date column. Often used to get the boundaries of the selected period.
PREVIOUSYEAR / PREVIOUSQUARTER / PREVIOUSMONTH / PREVIOUSDAYPREVIOUSYEAR(dates, year_end_date)
Sales Prior Year = CALCULATE([Total Sales], PREVIOUSYEAR('Date'[Date]))PREVIOUSYEAR / PREVIOUSQUARTER / PREVIOUSMONTH / PREVIOUSDAY returns a table containing all dates from the previous year (or quarter/month/day) relative to the current context.
NEXTYEAR / NEXTQUARTER / NEXTMONTH / NEXTDAYNEXTYEAR(dates, year_end_date)
Projected Next Year = CALCULATE([Forecast], NEXTYEAR('Date'[Date]))NEXTYEAR / NEXTQUARTER / NEXTMONTH / NEXTDAY returns dates for the upcoming year/quarter/month/day relative to the current context.
DATESBETWEENDATESBETWEEN(dates, start_date, end_date)
Sales Jan2023 = CALCULATE([Total Sales], DATESBETWEEN('Date'[Date], DATE(2023,1,1), DATE(2023,1,31)))DATESBETWEEN returns a table of dates between two specified dates. Useful for custom ranges that do not align with standard time periods.
DATESINPERIODDATESINPERIOD(dates, start_date, number_of_intervals, interval)
Sales Last 30 Days = CALCULATE([Total Sales], DATESINPERIOD('Date'[Date], LASTDATE('Date'[Date]), -30, DAY))DATESINPERIOD returns a table of dates starting from a specified date and extending forward or backward by a given interval.
OPENINGBALANCEYEAR / CLOSINGBALANCEYEAROPENINGBALANCEYEAR(expression, dates, filter, year_end_date)
Year End Inventory = CLOSINGBALANCEYEAR(SUM(Inventory[Quantity]), 'Date'[Date])
OPENINGBALANCEYEAR / CLOSINGBALANCEYEAR calculates the balance at the first or last date of the year. Commonly used in financial reports for inventory or account balances.
4. Text Functions
String Manipulation, Concatenation, and Formatting
Text functions manipulate string data. They are used in calculated columns and measures for formatting, concatenation, and extraction.
CONCATENATECONCATENATE(text1, text2)
Full Name = CONCATENATE(Customers[FirstName], " " & Customers[LastName])
CONCATENATE joins two text strings. For more than two strings, use the ampersand operator (&) or CONCATENATEX.
CONCATENATEXCONCATENATEX(table, expression, delimiter)
Product List = CONCATENATEX(Products, Products[Name], ", ")
CONCATENATEX iterates over a table and concatenates expression results with a delimiter. Useful for creating comma-separated lists.
LEFT / RIGHTLEFT(text, num_chars) / RIGHT(text, num_chars)
First Initial = LEFT(Customers[FirstName], 1)
Area Code = LEFT(Customers[Phone], 3)
LEFT / RIGHT extracts a specified number of characters from the beginning or end of a string.
MIDMID(text, start_position, num_chars)
Extracted Code = MID(Products[SKU], 4, 3)
MID extracts a substring starting at a specified position for a specified length.
LENLEN(text)
Name Length = LEN(Customers[FullName])
LEN returns the number of characters in a text string.
UPPER / LOWERUPPER(text) / LOWER(text)
Clean Email = LOWER(Customers[Email])
UPPER / LOWER converts text to all uppercase or all lowercase.
TRIMTRIM(text)
Clean Name = TRIM(Customers[RawName])
TRIM removes leading and trailing spaces, and reduces multiple spaces between words to single spaces.
SUBSTITUTESUBSTITUTE(text, old_text, new_text, instance_num)
URL Friendly = SUBSTITUTE(Products[Name], " ", "-")
SUBSTITUTE replaces existing text with new text. If instance_num is omitted, all occurrences are replaced.
REPLACEREPLACE(old_text, start_position, num_chars, new_text)
Masked Phone = REPLACE(Customers[Phone], 4, 4, "****")
REPLACE replaces a portion of a string with another string based on position.
SEARCH / FINDSEARCH(find_text, within_text, start_position, not_found_value) / FIND(find_text, within_text, start_position)
At Position = SEARCH("@", Customers[Email], 1, 0)SEARCH / FIND returns the starting position of a substring. SEARCH is case-insensitive; FIND is case-sensitive. SEARCH allows a not_found_value; FIND returns an error if not found.
FORMATFORMAT(value, format_string)
Formatted Sales = FORMAT([Total Sales], "$#,##0.00")
Month Name = FORMAT('Date'[Date], "MMMM")
FORMAT converts a value to text using a .NET format string. Useful for creating custom labels but should be used sparingly in measures as it returns text, not numbers.
VALUEVALUE(text)
Numeric Code = VALUE(Products[CodeAsText])
VALUE converts a text string that represents a number into a numeric value.
5. Logical Functions
IF, SWITCH, AND, OR, and Conditional Logic
Logical functions evaluate conditions and return values based on truth evaluations.
IFIF(logical_test, value_if_true, value_if_false)
Status = IF([Total Sales] > 10000, "High", "Low")
IF evaluates a condition and returns one value if true, another if false. The false branch is optional but recommended to avoid blank returns.
IFERRORIFERROR(expression, value_if_error)
Safe Division = IFERROR(DIVIDE(1, 0), 0)
IFERROR returns a value if the expression returns an error; otherwise returns the expression result.
SWITCHSWITCH(expression, value1, result1, value2, result2, …, else_result)
Quarter Name = SWITCH(SELECTEDVALUE('Date'[Quarter]),
    1, "Q1",
    2, "Q2",
    3, "Q3",
    4, "Q4",
    "Unknown"
)
SWITCH evaluates an expression and returns results based on matched values. More efficient and readable than nested IF statements. Also supports the TRUE pattern:
SWITCH(TRUE(), condition1, result1, condition2, result2, else_result).AND / ORAND(logical1, logical2) / OR(logical1, logical2)
High Value High Volume = IF(AND(Sales[Amount] > 1000, Sales[Quantity] > 10), "Yes", "No")
AND / OR returns TRUE if both (AND) or either (OR) conditions are true. For multiple conditions, use the operators && and || for better readability.
NOTNOT(logical)
Not High Value = IF(NOT(Sales[Amount] > 1000), "Low Value", "High Value")
NOT reverses the logical value. TRUE becomes FALSE, FALSE becomes TRUE.
TRUE / FALSETRUE() / FALSE()
Is High Value = IF([Total Sales] > 10000, TRUE(), FALSE())
TRUE / FALSE returns the Boolean values TRUE or FALSE. Often used in measures to return Boolean results for filtering.
BLANKBLANK()
Margin = IF([Total Sales] = 0, BLANK(), [Total Profit] / [Total Sales])
BLANK returns a blank value. Used to return empty results instead of zero.
ISBLANKISBLANK(value)
Missing Data = IF(ISBLANK(Sales[Amount]), "No Sale", "Has Sale")
ISBLANK returns TRUE if the value is blank. Blank in DAX is different from zero or empty string.
ISERROR / ISNUMBER / ISTEXTISERROR(value) / ISNUMBER(value) / ISTEXT(value)
Valid Number = IF(ISNUMBER(Value), "Numeric", "Not Numeric")
ISERROR / ISNUMBER / ISTEXT check the data type or error status of a value.
6. Mathematical and Statistical Functions
ABS, ROUND, DIVIDE, RANKX, Percentiles, and More
These functions perform numeric calculations and statistical analysis.
ABSABS(number)
Absolute Variance = ABS([Actual] - [Budget])
ABS returns the absolute (positive) value of a number.
ROUND / ROUNDUP / ROUNDDOWNROUND(number, num_digits)
Rounded Price = ROUND(Products[Price], 2)
ROUND / ROUNDUP / ROUNDDOWN rounds a number to the specified number of digits. ROUND uses standard rounding; ROUNDUP always rounds away from zero; ROUNDDOWN always rounds toward zero.
CEILING / FLOORCEILING(number, significance) / FLOOR(number, significance)
Round to 5 = CEILING(Sales[Amount], 5)
CEILING / FLOOR rounds a number up (CEILING) or down (FLOOR) to the nearest multiple of significance.
DIVIDEDIVIDE(numerator, denominator, alternate_result)
Margin % = DIVIDE([Total Profit], [Total Sales], 0)
DIVIDE performs division with built-in handling for division by zero. Returns alternate_result if denominator is zero. Safer than using the / operator.
POWERPOWER(number, power)
Squared = POWER(Sales[Quantity], 2)
POWER raises a number to the specified power. Equivalent to the ^ operator.
SQRTSQRT(number)
Std Dev Bound = SQRT([Variance])
SQRT returns the square root of a number.
MODMOD(number, divisor)
Even Row = IF(MOD([RowNumber], 2) = 0, "Even", "Odd")
MOD returns the remainder after division. Useful for conditional formatting based on parity.
INTINT(number)
Whole Quantity = INT(Sales[Quantity])
INT rounds a number down to the nearest integer.
RAND / RANDBETWEENRAND() / RANDBETWEEN(bottom, top)
Random Sample = RANDBETWEEN(1, 100)
RAND / RANDBETWEEN — RAND returns a random decimal between 0 and 1. RANDBETWEEN returns a random integer between bottom and top inclusive.
MEDIANMEDIAN(column)
Median Sale = MEDIAN(Sales[Amount])
MEDIAN returns the median (middle value) of a column.
PERCENTILEPERCENTILE.INC(column, k) / PERCENTILE.EXC(column, k)
90th Percentile = PERCENTILE.INC(Sales[Amount], 0.9)
PERCENTILE.INC / PERCENTILE.EXC returns the k-th percentile of values. INC includes 0 and 1; EXC excludes them.
RANKXRANKX(table, expression, value, order, ties)
Product Rank = RANKX(ALL(Products[ProductName]), [Total Sales])
RANKX returns the rank of a value in a table. The table is iterated, and the expression is evaluated per row. RANKX is an iterator function.
7. Date and Time Functions
Extract, Shift, and Calculate with Dates
These functions extract or manipulate date and time components.
DATEDATE(year, month, day)
Custom Date = DATE(2023, 1, 15)
DATE returns a date value from numeric components.
DATEVALUEDATEVALUE(date_text)
Converted Date = DATEVALUE("2023-01-15")DATEVALUE converts a text date to a date value.
YEAR / MONTH / DAYYEAR(date) / MONTH(date) / DAY(date)
Order Year = YEAR(Sales[OrderDate])
YEAR / MONTH / DAY extracts the year, month, or day from a date.
HOUR / MINUTE / SECONDHOUR(datetime) / MINUTE(datetime) / SECOND(datetime)
Hour of Day = HOUR(Sales[TransactionTime])
HOUR / MINUTE / SECOND extracts time components from a datetime value.
WEEKDAYWEEKDAY(date, return_type)
Is Weekend = IF(WEEKDAY('Date'[Date], 2) >= 6, "Weekend", "Weekday")WEEKDAY returns a number representing the day of the week. Return_type 1 = Sunday (1) to Saturday (7); 2 = Monday (1) to Sunday (7); 3 = Monday (0) to Sunday (6).
WEEKNUMWEEKNUM(date, return_type)
Week Number = WEEKNUM('Date'[Date])WEEKNUM returns the week number for a date.
NOW / TODAYNOW() / TODAY()
Current DateTime = NOW()
NOW / TODAY — NOW returns the current date and time; TODAY returns only the current date. These are volatile functions that recalculate on every refresh and every query.
DATEDIFFDATEDIFF(start_date, end_date, interval)
Days to Ship = DATEDIFF(Sales[OrderDate], Sales[ShipDate], DAY)
DATEDIFF returns the number of interval boundaries crossed between two dates. Intervals: SECOND, MINUTE, HOUR, DAY, WEEK, MONTH, QUARTER, YEAR.
EOMONTHEOMONTH(start_date, months)
End of Current Month = EOMONTH(TODAY(), 0)
EOMONTH returns the last day of the month, a specified number of months before or after start_date.
EDATEEDATE(start_date, months)
Six Months Later = EDATE(Sales[OrderDate], 6)
EDATE returns a date a specified number of months before or after start_date.
8. Parent-Child Functions
Hierarchy Navigation: PATH, PATHITEM, PATHLENGTH
These functions navigate hierarchical structures where rows reference other rows (e.g., employee-manager, bill of materials).
PATHPATH(ID_column, parent_column)
Employee Path = PATH(Employees[EmployeeID], Employees[ManagerID])
PATH returns a delimited text string containing all parent IDs from the current row up to the root. Typically used in calculated columns. Result:
"1|4|7|12" representing the chain of managers.PATHCONTAINSPATHCONTAINS(path, item)
Reports to CEO = PATHCONTAINS(Employees[Path], "CEO_ID")
PATHCONTAINS returns TRUE if the specified item exists within the path string.
PATHITEMPATHITEM(path, position, type)
Top Manager = PATHITEM(Employees[Path], 1, INTEGER)
PATHITEM returns the item at a specified position in a path. Position 1 is the root (top-level parent). Type INTEGER returns as number.
PATHITEMREVERSEPATHITEMREVERSE(path, position)
Current Employee = PATHITEMREVERSE(Employees[Path], 1)
PATHITEMREVERSE returns an item from the path counting from the end. Position 1 returns the leaf (current node).
PATHLENGTHPATHLENGTH(path)
Management Level = PATHLENGTH(Employees[Path])
PATHLENGTH returns the number of items in the path string.
9. Table Manipulation Functions
SUMMARIZE, ADDCOLUMNS, UNION, INTERSECT, and Set Operations
These functions return tables rather than scalar values. They are used in measures that require intermediate tables or in creating calculated tables.
SUMMARIZESUMMARIZE(table, groupBy_column1, groupBy_column2, …, name1, expression1, …)
Sales by Category = SUMMARIZE(
    Sales,
    Products[Category],
    "Total Sales", SUM(Sales[Amount]),
    "Order Count", COUNTROWS(Sales)
)
SUMMARIZE creates a summary table grouping by specified columns and calculating aggregated expressions. Commonly used in calculated tables.
SUMMARIZECOLUMNSSUMMARIZECOLUMNS(groupBy_column1, groupBy_column2, …, filter_table1, …, name1, expression1, …)
-- More flexible version of SUMMARIZE that allows filter tables and better performance
SUMMARIZECOLUMNS is a more flexible version of SUMMARIZE that allows filter tables and better performance. Used primarily in DAX queries.
ADDCOLUMNSADDCOLUMNS(table, name1, expression1, …)
Products with Margin = ADDCOLUMNS(
    Products,
    "Profit Margin", [Total Profit] / [Total Sales]
)
ADDCOLUMNS returns a table with new columns added. Does not remove existing columns. The expressions are evaluated in row context.
SELECTCOLUMNSSELECTCOLUMNS(table, name1, expression1, …)
Product IDs Only = SELECTCOLUMNS(Products, "ID", Products[ProductID])
SELECTCOLUMNS returns a table with only the specified columns. Useful for reshaping tables.
UNIONUNION(table1, table2, …)
Combined Sales = UNION(Sales2023, Sales2024)
UNION appends two or more tables vertically. All tables must have the same number of columns with compatible data types.
INTERSECTINTERSECT(table_left, table_right)
Common Customers = INTERSECT(Customers2023, Customers2024)
INTERSECT returns rows that appear in both tables. Duplicate rows are returned only once.
EXCEPTEXCEPT(table_left, table_right)
New Customers 2024 = EXCEPT(Customers2024, Customers2023)
EXCEPT returns rows from the left table that do not appear in the right table.
CROSSJOINCROSSJOIN(table1, table2, …)
All Combinations = CROSSJOIN(DISTINCT(Products[Color]), DISTINCT(Products[Size]))
CROSSJOIN returns the Cartesian product of all tables. Every row from table1 combined with every row from table2.
NATURALINNERJOIN / NATURALLEFTOUTERJOINNATURALINNERJOIN(left_table, right_table)
Joined Data = NATURALINNERJOIN(SalesSummary, ProductInfo)
NATURALINNERJOIN / NATURALLEFTOUTERJOIN performs a join based on columns with the same name in both tables. Does not require explicit relationship definition. INNERJOIN returns matching rows; LEFTOUTERJOIN returns all rows from left with matches from right.
ROWROW(name1, expression1, name2, expression2, …)
Single Row Table = ROW("Total", [Total Sales], "Count", [Order Count])ROW returns a one-row table with columns defined by the names and expressions.
10. Information Functions
ISFILTERED, HASONEVALUE, SELECTEDVALUE, and User Context
Information functions return metadata about values, such as data type or whether a value is filtered.
ISEVEN / ISODDISEVEN(number) / ISODD(number)
Row Color = IF(ISEVEN([RowNumber]), "White", "Gray")
ISEVEN / ISODD returns TRUE if the number is even or odd.
ISCROSSFILTEREDISCROSSFILTERED(table_or_column)
-- Returns TRUE if the column or table is cross-filtered by another column in the model.
ISCROSSFILTERED returns TRUE if the column or table is cross-filtered by another column in the model.
ISFILTEREDISFILTERED(column)
Has Category Filter = ISFILTERED(Products[Category])
ISFILTERED returns TRUE if the specified column has a direct filter applied (from a slicer, visual filter, or filter pane). Does not detect indirect filtering from related tables.
HASONEVALUE / HASONEFILTERHASONEVALUE(column) / HASONEFILTER(column)
Selected Category = IF(HASONEVALUE(Products[Category]), SELECTEDVALUE(Products[Category]), "Multiple")
HASONEVALUE returns TRUE if the column has exactly one distinct value in the current context. HASONEFILTER returns TRUE if the column has a direct filter applied and that filter yields exactly one value.
SELECTEDVALUESELECTEDVALUE(column, alternate_result)
Current Region = SELECTEDVALUE(Region[Region], "All Regions")
SELECTEDVALUE returns the single value when the column has exactly one distinct value; otherwise returns alternate_result. This is a convenience function that wraps HASONEVALUE and VALUES.
USERNAME / USEROBJECTID / USERPRINCIPALNAMEUSERNAME() / USEROBJECTID() / USERPRINCIPALNAME()
-- Return information about the current user. Used for row-level security (RLS) and personalized visuals.
USERNAME / USEROBJECTID / USERPRINCIPALNAME return information about the current user. Used for row-level security (RLS) and personalized visuals.
11. Statistical Functions
Standard Deviation, Variance, Correlation
Advanced statistical calculations beyond basic aggregation.
STDEV.P / STDEV.SSTDEV.P(column) / STDEV.S(column)
Population StdDev = STDEV.P(Sales[Amount])
STDEV.P / STDEV.S — standard deviation. P assumes the data is the entire population; S assumes it is a sample.
VAR.P / VAR.SVAR.P(column) / VAR.S(column)
Sample Variance = VAR.S(Sales[Amount])
VAR.P / VAR.S — variance. P for population; S for sample.
CORRELCORREL(columnX, columnY)
Correlation = CORREL(Sales[Price], Sales[Quantity])
CORREL returns the correlation coefficient between two columns.
12. Relationship Functions
CROSSFILTER and USERELATIONSHIP
Functions that manage or inspect relationships.
CROSSFILTERCROSSFILTER(column1, column2, direction)
Sales with Cross = CALCULATE(
    [Total Sales],
    CROSSFILTER(Sales[ProductID], Products[ProductID], BOTH)
)
CROSSFILTER modifies the cross-filtering direction of a relationship for the duration of the calculation. Used inside CALCULATE. Directions: NONE, ONEWAY, BOTH.
USERELATIONSHIPUSERELATIONSHIP(column1, column2)
Sales by Ship Date = CALCULATE(
    [Total Sales],
    USERELATIONSHIP(Sales[ShipDate], 'Date'[Date])
)
USERELATIONSHIP activates an inactive relationship for the duration of the calculation. Essential for scenarios like having both order date and ship date relationships to the same date table.
13. Iterator Functions (X-Functions)
Pattern and Performance Considerations
While many X-functions (SUMX, AVERAGEX, etc.) are covered in their respective categories, it is important to understand the pattern.
Iterator PatternFunctionX(table, expression)
SUMX, AVERAGEX, MINX, MAXX, COUNTX, COUNTAX, CONCATENATEX, RANKX
Iterator functions accept a table as the first argument, create a row context, evaluate an expression for each row, and aggregate the results. Use iterators when your calculation involves multiple columns, complex logic per row, or when you need to aggregate across a derived table.
Performance Consideration: Iterators can be slower than simple aggregations on large tables. Where possible, use calculated columns for row-by-row logic and then aggregate with SUM, or optimize by reducing the table size with FILTER or VALUES before iterating.
Performance Consideration: Iterators can be slower than simple aggregations on large tables. Where possible, use calculated columns for row-by-row logic and then aggregate with SUM, or optimize by reducing the table size with FILTER or VALUES before iterating.
Conclusion
DAX functions span a wide range of capabilities, from simple aggregation to complex filter manipulation and time intelligence. The key to mastering DAX lies not in memorizing every function but in understanding the behavior categories:
Aggregation functions give you basic math
Filter functions let you control context
Time intelligence handles date logic
Iterators enable row-by-row calculations
Table functions build intermediate structures
Each function category has its own evaluation rules, and combining them effectively is what separates basic measures from advanced analytics. Start with CALCULATE, SUMX, and FILTER—once you understand these, the rest become variations on core concepts.